
Aside from being the proud owner of CommeLesChinois.ca, I am also a computer/media/data specialist. Recently, I launched an updated version of my election maps with Cyberpresse. The map was designed using results by polling division from previous elections, the smallest available division for electoral results. Each of these polls has about 200-500 people living in them, and you can basically know what your block (if you live in the city) tends to vote for.
The consequence is voyeurism for political junkies. And I also like to go play with the maps, and decided to assemble a bunch of interesting ridings with relatively a strong proportion of Canadians of Chinese origin living in them. For that, I used Pundits’ Guide‘s fantastic tool for finding census data divided by riding.
I found that the Richmond riding, south of Vancouver was in fact the most “Chinese” (based on the 2006 census), with 50.2% of the population declared to be Chinese. The 2008 map is not in fact interesting, but juxtaposed with the 2006, shows the dramatic shift from Liberals (rep. by former cabinet minister Raymond Chan) to the Conservatives (Alice Wong). 2006 was when the Liberals lost power to Stephen Harper’s Conservatives.

Richmond in 2006…
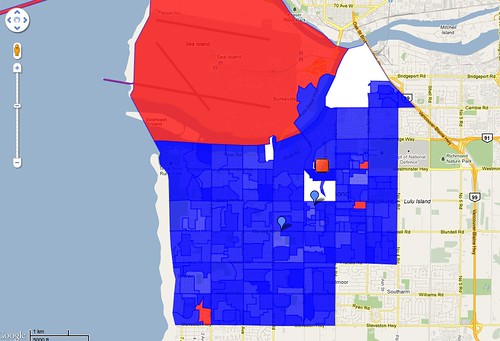
…and in 2008
Some ridings were won or lost by a hair. In the Vancouver area, the closest race happened in Vancouver South, the third most Chinese riding of the country (43.7%), where the MP is a Liberal, former health minister Ujjal Dosanjh. He won the last election by 20 votes.
The map by polls succeeds in showing that the vote was in fact hugely clustered among neighbourhoods. I don’t know the geography of Vancouver very well, but I’m almost certain that the strong groupings of red and blue (deeper the color, larger the margin of victory in a polling division) represent opposed socio-economical groups.
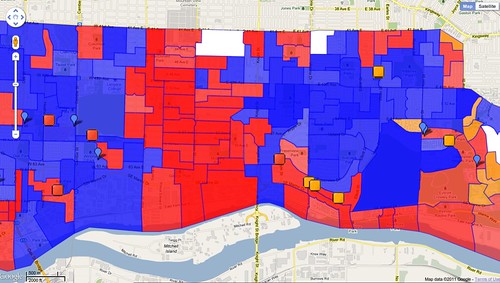
Vancouver South in 2008
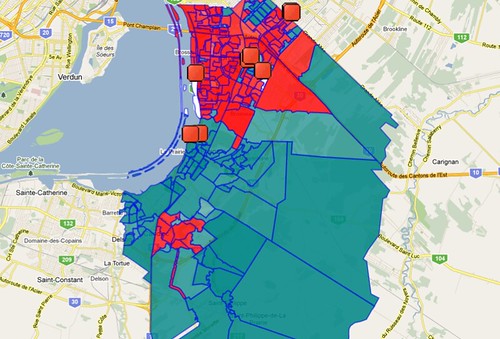
Brossard–La Prairie in 2008
The Montreal region’s most Chinese riding comes at a lowly 32nd position, with Westmount–Ville-Marie, a largely downtown riding. Brossard–La Prairie on the South Shore is in fact what people in Montreal recognize as the “Asian suburb”. With 7.5% Chinese, it is still a far cry from Toronto or Vancouver’s suburbs.
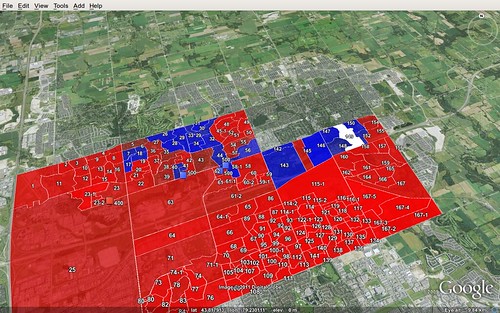
The contrast in the map is striking, but expected. The northern portion of the riding is Brossard, where a large Asian population lives and where the Liberal vote is concentrated. La Prairie to the south tends to be typical “450”, middle-class French Canadian, seems to be voting Bloc. The race for this suburban riding was won by as little as 69 votes.
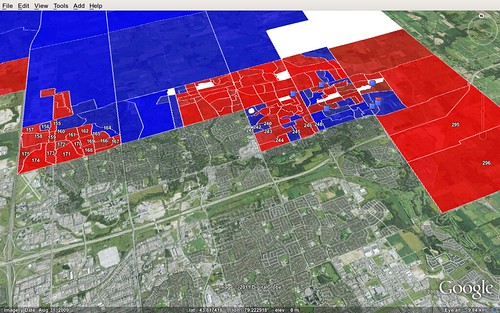
Oak Ridges–Markham in 2008
Markham–Unionville in 2008
In some other cases, the municipalities are split over different ridings. Markham, with one of the largest Chinese populations in the Toronto area, is comprised within the ridings of Oak Ridges–Markham (Conservative) and Markham–Unionville (Liberal).
(Fellow Montrealer living in Hong Kong Christopher DeWolf also wrote a post on his website Urbanphoto.net about the use of this map for street by street vote analysis.)